In this article Feathered Owl explains some basic Enterprise Systems Management concepts. This piece was originally titled “Idiot’s Guide to Enterprise Systems Management”. Think of it that way if you prefer….
A Brief History of ESM
ESM as a discipline has developed as a result of the widespread migration from centralised mainframe and/or midrange computers to smaller distributed computers that has taken place throughout the IT industry over the past 10 to 15 years. ESM aims to solve one of the major difficulties associated with an IT infrastructure comprising large numbers of small computers distributed over a network, namely that these are inherently more difficult to manage than a smaller number of larger computers. As well as the computer and network hardware and operating systems, applications which run on the computers and which often span multiple computers, networks and geographical locations must also be managed. Many modern distributed computing infrastructures are highly complex; as a result, management of these has become a major challenge.
ESM as a recognised discipline has been around for about the last 10 years, and originated in the networking arena where the problems of remotely monitoring and administrating multiple devices were encountered before the big rush toward distributed computing. A special management communications protocol (SNMP – simple network management protocol) was developed as part of the overall protocol suite (TCP/IP) which allowed network devices from different manufacturers to exchange data with each other. As the computers which were attached to the network themselves became smaller, more numerous and more widely dispersed, network management techniques were extended into the server arena. Although SNMP is still used for the vast majority of network management applications, and remains the only globally-supported standard for server and application monitoring and management.
Basic Principles of ESM
The most basic challenge that any ESM solution aims to solve is monitoring the status of all components of the IT infrastructure and, ideally, the applications that run within in. Like any machine, computers need to be checked periodically to ensure that they are functioning optimally. Consider a scenario where a single systems administrator (SA) is available to monitor all the computers in a company’s IT infrastructure. It takes the SA five minutes to log on to each computer and perform a basic set of health checks. It is not unusual for large companies to have hundreds or even thousands of computers in their datacentres; if it takes 5 minutes to check each one of these, every 100 computers would require one SA simply to perform basic daily healthchecks for a full 8-hour working day. Clearly this is not efficient use of resources.
The solution to this problem is to install “agent” software on each computer and have this perform the healthchecks instead, freeing up the SA’s time to perform more useful activities. A further advantage is that the agent can be configured to carry out healthchecks at frequent regular intervals; in practice, checking computer once a day is simply not sufficient – in cases where business critical functions are supported, computers need to be checked at intervals of five minutes or less. Although each agent software license may cost a few hundred pounds, this will quickly be recouped in time savings for SA’s time which may cost anything up to £500 per day.
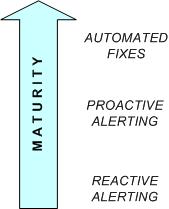
If an agent detects a problem, it can be configured to generate an alert message in order to let the SA know that there is something he or she needs to take a look at and fix. This is known as reactive alerting. Ideally, if an agent could detect that a problem was about to happen and send an alert to the SA, allowing preventative measures to be taken to stop it happening, this would be a better state of affairs as there would be no interruption to service. This kind of proactive monitoring is typically what is aimed for by ESM system designers.
Another kind of action which can be taken by a monitoring agent when an actual or impending fault is detected is to initiate a corrective action to prevent or resolve the issue. This is only usually possible where the detected fault (actual or impending) is a recognised one for which a standard fix is available. In such a case, the agent may be configured to execute a command or script to apply the fix. A notification may still be sent to the relevant support staff, however in this case it informs them that a known problem had occurred and has been automatically resolved – no further action is required, although it may be desirable to investigate further to prevent the problem from re-occurring.
The scenarios described above can be though of as an evolution from basic to more sophisticated monitoring functionality: –
ESM Architectures
ESM systems need their own architecture to function effectively. As well as agents which actually do the monitoring, some kind of management server is required to receive and process alerts sent by the agents, with a console to allow alert viewing and agent configuration. A simple generic ESM architecture can be depicted as follows: –
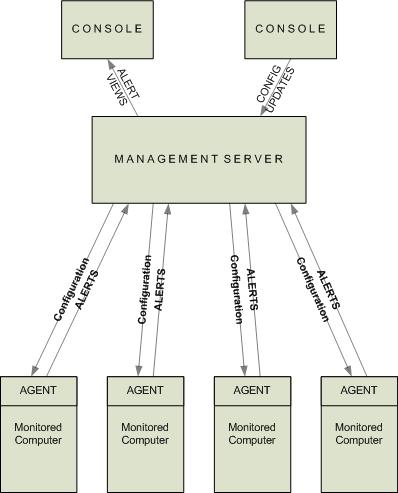
ESM is now generally accepted to be an essential element of any well-designed and managed distributed IT infrastructure. Without an ESM capability, it is virtually impossible to ensure that everything will function properly without support personnel constantly checking all computers and applications. In many larger organisations, ESM is the responsibility of dedicated teams.
ESM Vendors
As distributed IT infrastructures have become larger, more powerful and more complex, the requirement to monitor and control them has increased proportionally. A small number of major ESM “framework” vendors (HP, IBM, CA and BMC) continue to dominate, but an increasing number of smaller players have entered the marketplace, aiming to fill in the gaps not well covered by the framework vendors, concentrate on one specific area and do that better than vendors offering a wider overall capability, or simply to provide equivalent functionality at much lower cost.
Agentless Monitoring
An alternative to deploying agents to every monitored system is to use an agentless approach, with checks on status and health being performed remotely from other computers dedicated to this task. Typically, agentless monitoring is carried out using generic means of accessing the monitored computers provided by the manufacturers. The advantage of the agentless approach is that no additional software has to be deployed to the monitored systems; typically, a user account and password are created for the monitoring systems to periodically log on to the monitored system and perform the desired checks; any detected anomalies result in an alert being raised and sent to the relevant support personnel in the same manner as for agent-based monitoring described above.
The main disadvantages of agentless monitoring are that it can result in higher levels of network traffic between monitored systems and the management server, generally making it less suitable for use over slow-speed network links. Additionally, if contact is lost between the management server and the monitored system, no monitoring can be performed (agent based monitoring solutions invariably support alert buffering at the agent with store and forward capability allowing alerts to be sent to the management server once contact is re-established).
The main advantage of agentless monitoring is that it is generally easier to deploy and maintain as no additional software needs to be deployed to monitored systems and all monitoring configurations are held on the management server. Agentless monitoring also lends itself well to situations when it is desirable to test availability of a service remotely (e.g. a website or email relay server) as this is reflective of how the service is accessed by users.
Network Monitoring
As mentioned earlier, the technologies and techniques used in ESM originated in the Network arena, and continue to be used in pretty much the same way up to the present day. As well as monitoring network devices (hubs, switches, routers, remote access servers and so on) for faults and performance statistics, network monitoring solutions also map the network topology and connectivity (logical & physical) between devices. This connectivity information is vitally important detecting, troubleshooting and resolving network problems. Perhaps the most widely-used application for network device, topology and connectivity monitoring is HP OpenView Network Node Manager (NNM).
A further key function is to manage the configurations of network devices. Network device configurations take the form of instruction sets stored on the hard disk or in flash memory on the device, and can be manually amended via a remote login, or uploaded via FTP (file transfer protocol). In any large network, it is not feasible to manually maintain configurations on all devices individually; it is preferable to store, maintain and update configurations on a central computer and distribute these out to devices on the network as required. Where configuration updates have to be distributed to a number of devices, it may be desirable to schedule these automatically and perform them overnight or at weekends to minimise disruption. If any problems with new configurations are encountered, the ability to “roll back” to a previous configuration which was known to work properly is also valuable.
CiscoWorks is a network device configurations manager used in many sites using Cisco network kit.
Hardware Element Managers
Although they may share common architectural principles or be based on generic standards, each computer hardware vendor’s products are generally sufficiently different to require a proprietary software tool to monitor hardware health and manage hardware configurations such as firmware revisions. Such tools are known as “element managers” and a comprehensive ESM solution will typically contain a number of different element managers from the manufacturers of each type of hardware device in use with the organisation’s IT infrastructure.
Because their functionality is limited to monitoring of specific proprietary hardware, element managers are typically integrated into other generic monitoring tools designed to accept alerts from multiple disparate sources via standards-based interfaces such as SNMP.
Examples of hardware element managers include HP Insight Manager (HP and Compaq server hardware) and Sun Management Centre (Sun Microsystems server hardware), Dell OpenManage. CiscoWorks (see “Network Monitoring”) is also an element manager.
Application Monitoring
Any IT infrastructure exists solely to support the activities of the organisation using it. Functionality is provided to users by software applications; whilst monitoring the availability and performance of underlying infrastructure will go some way toward ensuring that they function correctly, if applications themselves can be directly monitored then a more complete and accurate picture emerges.
Much of the activity in the ESM marketplace in recent years has been concentrated around application monitoring. Infrastructure monitoring is now a relatively mature activity dominated by a small number of established players with official or de facto standards in place. In contrast, application monitoring is a rapidly growing sector with hundreds of vendors providing a plethora of mainly proprietary solutions to satisfy demand created by organisations looking to improve the quality of application service delivery. The adoption of a “service orientated” IT delivery model (where services delivered to users are the focus, as opposed to how well individual elements of the IT infrastructure are working) is further fuelling the interest in application monitoring and encouraging further new entrants into this marketplace.
Although few if any standards have emerged in the area of application monitoring, some common principles and techniques are, at least, used by all solution vendors. Most if not all applications operate via transactions. A transaction is an activity or series of linked activities, which are performed using an application and which deliver a useful result. Examples of transactions include performing a search via a Web search engine, creating a new customer record in a CRM system, running an online management report, making a credit card payment via a secure website and so on.
As discussed earlier, modern IT infrastructures tend to be highly distributed with tens, hundreds or even thousands of computers interlinked via networks being used to deliver applications to users. It is the norm for the successful execution of application transactions to be reliant upon multiple infrastructure components and network connections, all of which must be functioning effectively. Applications may also be reliant upon other applications, which themselves have their own infrastructure and perhaps application dependencies. Take the example of a Web-based application provided by an airline which allows customers to view schedules and book seats. The infrastructure which supports the application is as follows: –
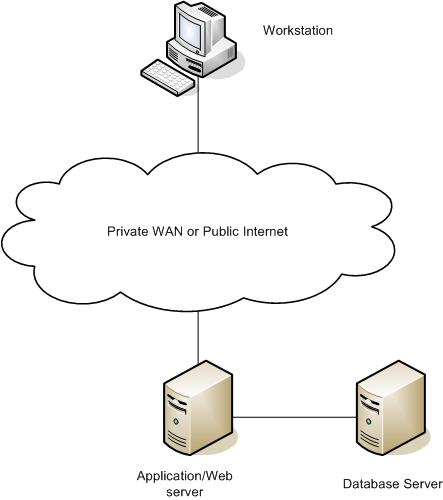
A typical transaction would be to request information on available flights and prices for a specified origin, destination and date as the first step in booking a flight. The sequence of operations is as follows: –
- User enters address for website in their Web browser
- User selects link to “book flights” form (page); form is loaded from Webserver into Web browser
- User enters “From” and “To” airport, date and whether it is a one way or return flight; click on “Search Flights”
- Information entered into form is sent to application server which in turn issues a “select” statement against the back end database to find all data matching the criteria entered into the “book flights” form
- Data matching the selection criteria are sent back to the application server by the database server
- Data are formatted for display in the “book flights” webpage by a script running on the application server
- Formatted Web page containing requested data is uploaded to the Web server
- User’s Web browser displays updated web page with available flights, times and prices
So, even a relatively simple everyday transaction is made up of a number of steps and reliant upon a number of different pieces of infrastructure and software, all intercommunicating over a network. Each of these components is monitored using the appropriate element manager (server hardware), agent & management server (server operating system, database, application and webserver processes), network monitoring tool (network devices, topology & connectivity) and agentless monitoring tool (flight booking website availability). To complete the monitoring picture, it is necessary to monitor the individual steps making up the overall transaction to ensure that: –
a) Each transaction step completes successfully
b) Each transaction step completes within the required time limit
c) The overall transaction completes successfully
d) The overall transaction completes within the required time limit
Typically, a number of approaches may be taken to monitor the application transaction. One way is to use a robot to periodically perform the transaction in order to simulate what is being done by real users. If this synthetically-generated transaction fails or takes too long, then it is reasonable to assume that the same problem would be experienced by a real user.
Another approach would be to install a piece of agent software onto the PC from where the user is accessing the application, and to monitor the stream of instructions being processed by the PC operating system as the transaction is executed. An agent could also be installed on the application server and work in a similar manner. The advantage of this approach is that all transactions being processed by the application server are visible, as opposed to the far lower number of transactions that would be executed on a single user’s PC. These approaches are known as client and server instrumentation.
Another approach again is to use a network probe to capture data being transmitted over the network and deduce what transactions are being performed, by whom, from which locations, how long they are taking and whether they are successful from the captured data.
In each case, the monitoring technology used needs to be configured to recognise the application transactions to be monitored. In the case of synthetic transaction generation, this is done by “recording” transactions executed by a real user; in the case of client or server instrumentation or network data capture, this can be done either by performing sample transactions on an otherwise quite server/network infrastructure, or, as is more common nowadays letting the technology capture data for an extended period so that it can “learn” which transactions are taking place and whet they do from the information contained within the captured data.
The choice of approach for application monitoring will depend on many factors such as infrastructure platforms used, application architecture, number of users, transaction volumes, size of network and others considerations, not least price. Once configured, the chosen monitoring tool will generally need to be integrated into the incumbent framework application (if present). Alternatively, most application monitoring vendors supply their own full-capable management server, administration and event browser consoles.
6 responses to “Enterprise Systems Management Concepts”
[…] here: Enterprise Systems Management Concepts « Feathered Owl Technology Blog var addthis_pub = ”; var addthis_language = ‘en’;var addthis_options = ’email, favorites, digg, […]
[…] post: Enterprise Systems Management Concepts « Feathered Owl Technology Blog Tags: agent, application, approach, article, case, computers, database, esm, Infrastructure, […]
[…] Read the rest here: Enterprise Systems Management Concepts « Feathered Owl Technology Blog […]
[…] post: Enterprise Systems Management Concepts 27 Sep 09 | […]
Thank you for this writeup its definately useful to understand the basics of ESM. Thanks for sharing.
Thanks, well this is pretty good to grasp as i get prepared for careers in Systems since am an Engineer under training. Love it!